
Machine Learning and Data Science with Python
In this post, we will see one of the usage of machine learning using Python. But, initially we need to understand what machine learning is. Let’s talk about it.
Machine Learning is getting computers to program themselves. If programming is automation, then machine learning is automating the process of automation.
What is Machine Learning?
If programming is automation, then machine learning is automating the process of automation. By machine learning one can study the design of algorithm. Python is a complete language and platform that you can use for both research/development and developing production systems. The main tasks as a part of learning “Machine Learning” are “clustering”(group of data which is in same pattern or context) and “finding predictive patterns” means you need to understand possible ways to solve the given problem. These tasks are learned through available data that were observed through experiences or instructions.
Machine learning has a number of well-known steps:
- Define Problem: Define the given problem so that you can any research on it.
- Prepare Data: Collect data as a dummy data or real time data whatever you want.
- Evaluate Algorithms: After research on it. Find the best algorithm to solve the problem and evaluate it.
- Improve Results: Get the resultant data and analyse it. And based on requirements improve the resultant data in such a way that it can be visualize.
- Present Results: And finally prepare the result in any user friendly format so that anyone can understand the prediction of given problem.
Now, let’s start with simple machine learning project using Scipy libraries.
Installation
Prerequisite is you have already installed python in your system. There are 5 key libraries for python Scipy libraries you need to install:
- scipy
- numpy
- matplotlib
- pandas
- sklearn
You can install these libraries using python -m pip install--user numpy scipy matplotlib ipython pandas and pip install -U scikit-learn if any error please refer this and this.
Start using it
I recommend working directly in the interpreter or writing your scripts and running them on the command line rather than editors/IDEs. Keep things simple and focus on the learning.
- Check the versions of the libraries
- Load dataset
We are using pandas to load the data. Note that we are specifying the names of each column when loading the data.
- Summarize the dataset
In this we can see the dimensions of dataset, peek the head of the data, distribution of dataset by attribute and statistical summary of the dataset.
- Data visualization
In this you can visualize the dataset in a graphical representation using libraries of Scipy.
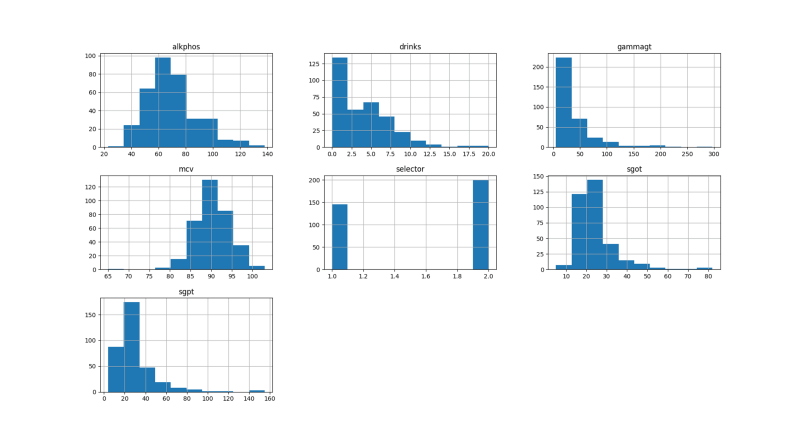
We can create a histogram of each input variable to get an idea of the distribution.
You will get result like this:
If you want to see different kind of visualisation then please refer to this.
If you have used line graph then you will get this result
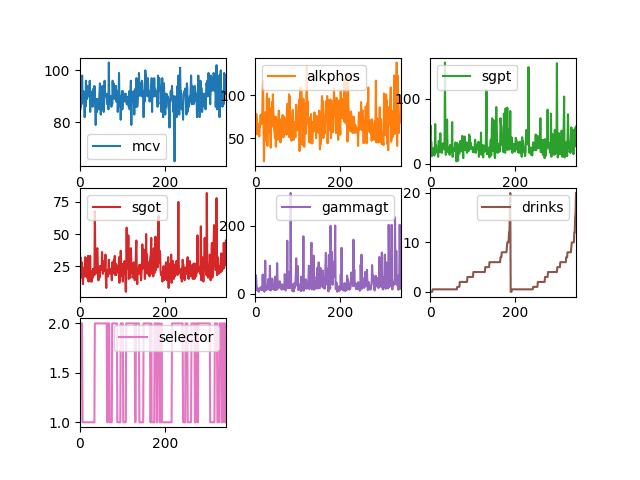
Line Plots
Now we can look at the interactions between the variables. The diagonal grouping of some pairs of attributes suggest a high correlation and a predictable relationship.
You will get result like this:
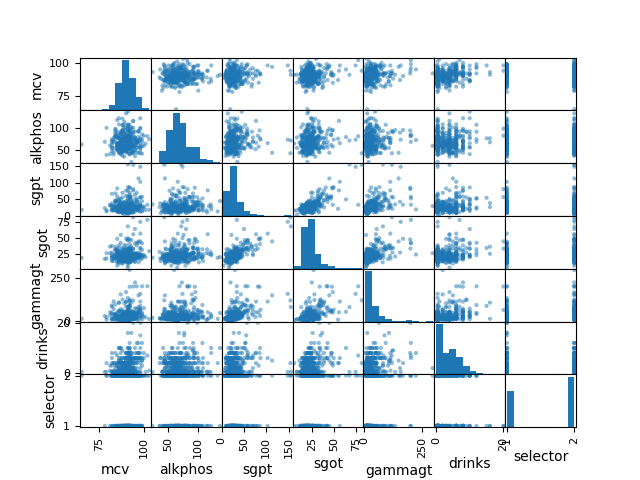
Scatterplot Matrix
This way you can visualize the dataset in different formats.
Click here for more details…
At BoTree Technologies, we build enterprise applications with our Python team of 15+ engineers.
We also specialize in RPA, AI, Django, JavaScript and ReactJS.

